


Exploring Imaging in Oscillatory Resonance AFM Modes: Backgrounds and Applications
Application Note 095 (pdf 3.8 Mb)
Sergei Magonov, Sergey Belikov, John Alexander and Marko SurtchevNT-MDT Development Inc, Tempe AZ, USA
- A set of oscillatory resonance AFM modes is expanded with frequency modulation mode and frequency imaging in amplitude modulation mode.
- Frequency modulation mode provides a superior capability in imaging at broad force range and enhances studies at low probe-sample forces.
- Frequency imaging in amplitude modulation provides the elastic modulus-related contrast and substantially complements the phase imaging in visualization of surface structures and compositional imaging of heterogeneous materials.
Latest developments of NT‑MDT SI microscopes, which are based on an advanced controller, allow enabling two oscillatory resonance modes that complement amplitude modulation with phase imaging – the most applicable AFM mode so far. Phase locked loop is utilized in both techniques: amplitude modulation with frequency imaging and frequency modulation modes. The comparative studies of a number of samples were conducted in all three resonance modes, and each of them has unique features that can be employed in concert for comprehensive materials characterization.
INTRODUCTION
Developments of non-contact imaging in Atomic Force Microscopy (AFM) took an unexpected twist in 1993 when the engineers at Digital Instruments found that intermittent tip-sample contact in the resonant oscillatory mode with large amplitudes provides the images of surfaces with high spatial resolution [1].
In this operation the AFM probe is driven into oscillation at its resonant frequency. A drop of the probe amplitude, which is caused by tip-sample interactions, is used to track the surface profile. This amplitude modulation (AM) mode has been further expanded by recording the phase changes, which provide the image contrast distinguishing the dissimilar components of heterogeneous materials.
For more than 20 years, AM mode with phase imaging has been the primary AFM method for applications in air and under liquid.
In UHV studies, the high-quality factor of the oscillating probe makes this mode impractical, and the changes in the probe frequency caused by tip-sample interactions are used for imaging of surfaces in frequency modulation (FM) mode [2]. The applications of FM mode are not limited by UHV conditions, and several research groups employ this mode for studies in air and under
liquid [3].
In this application note we provide a theoretical outlook on the resonant oscillatory AFM modes and describe the implementation of an extended set of such modes in NT‑MDT SI microscopes. A rational comparison of these techniques is given below in practical examples obtained on a number of samples. Special attention is paid to the control of the tip-sample force interactions and analysis of the height, phase, and frequency images as well as dissipation maps, which are calculated and displayed simultaneously
with
other images in these modes.
THEORETICAL OUTLOOK
The AFM probe oscillations, which are influenced by the tip-sample forces, can be modeled by an Euler-Bernoulli equation. An asymptotic KBM (Krylov-Bogoliubov-Mitropolsky) approach has been applied to solve this equation, and the solution for the 1st Eigen mode is expressed by the following two equations [4]:
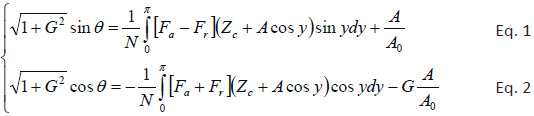
where 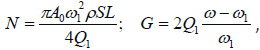 and ω is the actual frequency of the probe, ω1 is the 1st resonant frequency of the probe, θ is the phase of the oscillating probe, Q1 is the quality factor of 1st resonance; A is actual amplitude of the probe, A0 - the amplitude of the probe in free oscillation, Fa is the tip-sample force acting on the probe approach, Fr is the tip-sample force acting on the probe retract, Zc is a vertical position of the tip apex at
the central probe level, ρ is density of the probe material, S is the cross-section area of the cantilever, L is the length of the cantilever.
and ω is the actual frequency of the probe, ω1 is the 1st resonant frequency of the probe, θ is the phase of the oscillating probe, Q1 is the quality factor of 1st resonance; A is actual amplitude of the probe, A0 - the amplitude of the probe in free oscillation, Fa is the tip-sample force acting on the probe approach, Fr is the tip-sample force acting on the probe retract, Zc is a vertical position of the tip apex at
the central probe level, ρ is density of the probe material, S is the cross-section area of the cantilever, L is the length of the cantilever.
These equations relate the characteristics of the oscillating probe (frequency - ω, amplitude - A, and phase - θ) with sample topography (Zc) and the tip-sample forces (Fa and Fr when the probe respectively approaches a sample and retracts from it.
The forces can be of different origin but this paper will focus on the integrated Lennard-Jones model and the mechanical interactions described by various solid state models (Hertz, DMT, etc). The derived equations (Eqs. 1-2) contain the integral expressions, which are dominated by dissipative interactions when (Fa - Fr) differs from zero and by conservative interactions dependent on (Fa + Fr). These two equations contain four variables (A, ω, θ and Zc),
and their solutions can be obtained for two variables when the other two are fixed. As surface topography is the variable a researcher is interested in, there are three cases in which the frequency and amplitude (case 1), the phase and frequency (case 2), or the phase and amplitude (case 3) held constant.
Essentially these cases are implemented in different oscillatory AFM modes when the operation proceeds near or at the probe resonant frequency. In traditional AM mode, the driving frequency is fixed at (or near) probe resonance and a set-point amplitude (A = Asp) is selected lower than A0.
The Zc displacements, which keep the amplitude at Asp level in every surface location, are used for the construction of a height image, and the phase changes are reflected in the phase image. In FM mode, the probe phase θ is kept at 90 degrees by adjusting the driving frequency ω to be at the actual probe resonance, which is shifted due to the tip-sample forces. In this mode one selects a set-point frequency shift (∆ωsp) for tracking the surface topography. In addition to height
image, the probe amplitude is monitored and reflected in amplitude image.
The third case refers to fixing the phase at 90 degrees and the probe amplitude at a set-point level. In this operation, height image represents the surface topography, and concurrently recorded frequency image reflects the frequency variations caused by the gradient of the FvZ curve.
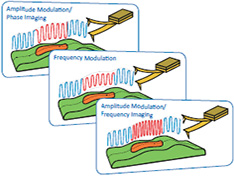
This lesser known mode may have undiscovered values in its applications for AFM practitioners. We will name this mode as amplitude modulation with frequency imaging (AM‑FI) and traditional AM mode as amplitude modulation with phase imaging (AM‑PI). The above descriptions comprise the set of three AFM modes, which are summarized in Table 1 below. In this table the fixed variables are combined with the means of the electronic control, measured signals, and imaging channels.
Table 1. Three resonance oscillatory modes, related resources and signals
| Name | Fixed Variables | Means of Control | Imaging | Measurements | Dissipation |
Amplitude Modulation/ Phase Imaging - AM-PI |
Δω=0, A(ω1)=constant |
Generator atω1 Z-servo for A(ω1) |
Z&θ | A&θ by LIA | 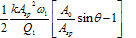 |
Frequency Modulation - FM |
θ=90o; Δω=constant |
PLL for θ-servo Z-servo for Δω |
Z&A | A&Δω by PLL | 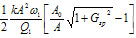 |
Amplitude Modulation/ Frequency Imaging - AM-FI |
θ=90o; A(ω)=constant |
PLL for ω-servo Z-servo for A(ω) |
Z&Δω | A&Δω by PLL | 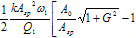 |
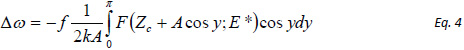
Besides the fixed and measured variables, additional calculated properties can be obtained in these modes. One of such properties can be dissipation of the probe energy over a period -  , which is expressed as
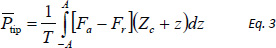
This equation, when applied to the discussed modes, leads to the expressions of tip energy dissipation provided in table 1. The calculation of energy dissipation can be performed while scanning, and the related map can be generated practically simultaneously with other images.
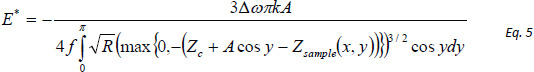
If a conservative part of the force 1/2(Fa + Fr) is described by Hertz model
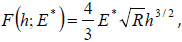
then the elastic modulus can be calculated from frequency variations in AM-FI using equations 4 and 5.
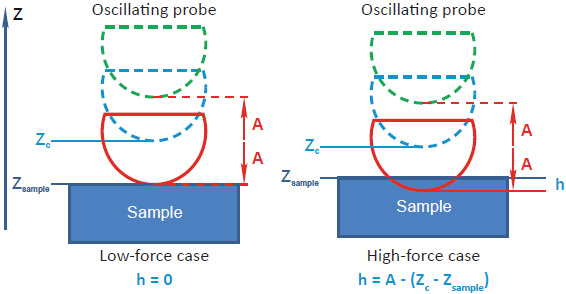
A relation between a probe penetration - h, oscillation amplitude - A, a central position of the tip apex - Zc and sample surface - Zsurface, which is common for AM‑PI and AM‑FI modes, is illustrated in Figure 1.
In fact, there is similarity of the expressions of ∆ω and cosθ in AM-FI and AM-PI modes. Therefore, the elastic modulus calculations can be performed for both modes, and this is a subject for further developments.
INSTRUMENTAL IMPLEMENTATION OF FREQUENCY IMAGING AND FREQUENCY MODULATION
The electronics needed for practical implementation of AFM oscillatory resonant modes include lock-in amplifiers (LIA) and phase locked loop detector (PLL). LIA is employed in AM-PI mode for measurements at the fixed frequency at or near the probe resonance prior to an influence of tip-sample forces.
In AM-FI mode, PLL is used for keeping the probe phase at 90 degrees in order to drive the probe at the resonance, which is shifted due to tip-sample forces. The new NT‑MDT SI controller incorporates these electronics and the schematics in Figures 2a-b show how PLL is implemented in AM-FI and FM modes.
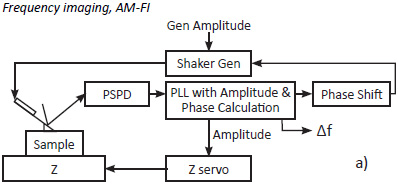
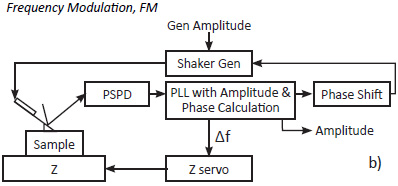
Figure 2a-b. Schematics of the practical implementation of AM-FI (a) and FM (b) modes
In both modes, PLL tracks the incoming deflection signal and its internal reference frequency changes to match that of the incoming signal.
PLL with amplitude/phase calculation is based on Costas loop [5] implementation that includes the in-phase and quadrature branches. Similar to LIA, they record the amplitude × sinθ and amplitude × cosθ signals. Amplitude and phase are calculated from these two measurements by standard trigonometry.
The PLL’s out coming signal at the updated frequency is sent to a shaker generator and its phase is shifted to maximize the amplitude of the probe. In this way the resonance of the probe interacting with the sample is found. A computer simulation of PLL performance shows that tracking of frequency changes is accomplished in a few oscillatory cycles.
At higher PLL’s gains a number of cycles are reduced for an expense of tracking accuracy. The default gain was chosen by a simulation evaluating the trade-off between the tracking speed and measurement accuracy for the 10 kHz – 1 MHz range.
In AM-FI mode the amplitude, which is calculated by PLL, is used for Z servo that helps find the sample topography. The change of frequency (∆ω) is used for a construction of the frequency image. In FM mode, which is realized in a similar way, the ∆ωsp is used for Z servo, and the amplitude changes are collected in the amplitude image. Therefore, in both AM-FI and FM modes the height images are accompanied, respectively, by frequency and amplitude images.
EXPERIMENTS IN AM-FI AND FM MODES
Experiment optimization and image analysis can be facilitated by frequency changes. We have analyzed how the tip-sample interactions change the probe resonance using the above integral equations.
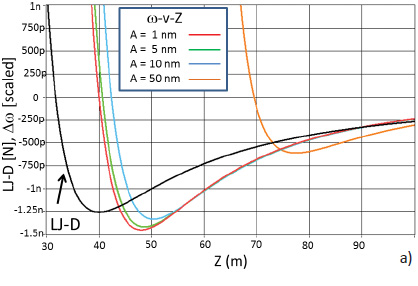
The force-versus-distance (FvZ) dependence was simulated using an integrated Lennard-Jones model with Deruigin approximation [6], which accounts for a probe-sample geometry (plane-sphere) in AFM, Figure 3a. A summation of repulsive and attractive branches results in a typical FvZ curve with an attractive well. A description of tip-sample attractive and repulsive forces is most relevant for a quasi-static situation. The cantilever’s bending above or below its initial level defines an overall force effect. The
FvZ curve recorded in quasi-static AFM regime is similar to the curves described by theoretical models. In oscillatory AFM modes, the dynamic probe parameters exhibit distance dependences different from FvZ curve.
The calculations of the frequency-versus-distance (ωvZ) curves were made for a probe vibrating around its central position with amplitudes of 1 nm, 5 nm, 10 nm and 100 nm.
The ωvZ curve for 1 nm oscillation mimics a force gradient dependence on distance. The frequency is lowered from its initial value and reaches a minimum at the distance where FvZ curve exhibits an inflection point.
At smaller probe-sample separations the ωvZ curve monotonically increases and frequency surpasses its initial value at the distance where the repulsive forces dominate in quasi-static operation. The ωvZ curves for larger amplitude are shifted away from the sample and the probe-sample interactions are averaged over different force regions that make the use of smaller amplitudes preferential for understanding the frequency changes.
The description in terms of attractive and repulsive force regimes is often used for operation with negative and positive frequency shifts. Particularly, the operations at negative frequency shifts are connoted as the true attractive force regime (at the distances before the frequency minimum) and the overall attractive force regime (at the distances between the frequency minimum and zero-crossing).
In AFM experiments, the probe response to its interactions with a sample is detected, and it is quite difficult to judge the position of the probe apex with respect to the sample. Therefore, an assignment of the operation in the true attractive force regime to the non-contact imaging is only a rational guess. It is more important to consider the practical consequences of ωvZ curve for a realization of FM mode, in which the frequency shift is employed for topography tracking.
As a monotonic trend of ωvZ curve changes at its minimum from the decreasing to increasing type, logic of the servo control with respect of ∆ωsp should be also changed. Therefore, there are two alternative regimes of FM operation. In one regime, the servo control is initiated when the decreasing frequency value reaches a negative ∆ωsp.
Further changes of ∆ωsp cover the operation at distances before the frequency minimum is reached. In the other regime – the servo control is initiated when the increasing frequency shift reaches a positive ∆ωsp. In this regime, FM mode can be performed at distances smaller than that of the frequency minimum, and it covers the regions with positive and negative frequency shifts. Therefore, a sample imaging can be performed at the same negative ∆ωsp from both sides of the ωvZ
minimum.
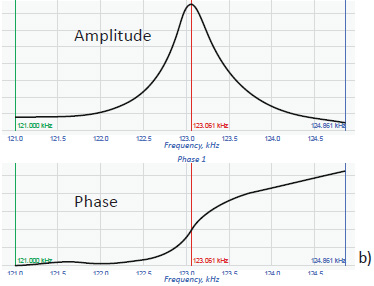
As we will compare the results obtained in different oscillatory modes it is worth mentioning that according to NT‑MDT SI convention, the phase-versus-frequency dependence is defined with the phase curve rising from negative values at frequencies below the probe resonance to a zero level at the probe resonance and to positive values at higher frequencies, Figure 3b.
Therefore a negative/positive frequency shift of an actual probe resonance leads to positive/negative phase values at the initial resonant frequency. In this convention, the stiffer locations in AM-PI high-force imaging are usually seen with darker phase contrast. In the case of microscopes from other manufacturers, the above convention and phase contrast assignment can be different [7].
PRACTICAL VERIFICATION OF OSCILLATORY RESONANT AFM MODES
Fundamentally, the described oscillatory AFM modes utilize different responses of the same tip-sample force interactions that can be applied for extracting quantitative information about surface topography and its local properties. Besides this general similarity, these modes have also specific features. In AM-FI and FM the probe is forced to resonate at frequencies different from its natural resonance in free oscillating state. Therefore, the probe-sample interactions in these modes are dissimilar to those in AM-PI mode.
Particularly, a peak force in AM-PI measurements is a largest at Asp ~0.5 A0 [8] and decreases at smaller Asp because driving the probe far from its effective resonance becomes less efficient. In the case of AM-FI, a peak force is expected to increase monotonically with a decrease of Asp.
This expectation was confirmed in studies of the height of the brush-like macromolecules (see below). The differences influence the image contrast and help improve the characterization of materials. The complexity of the theoretical relationship of the probe responses and sample properties underlines a need in the practical and comparative verification of these modes.
This will help understanding their complementarity in comprehensive surface analysis. By comparing the results obtained on a number of samples in three oscillatory modes, we intend to evaluate their capabilities for examination of surfaces at various forces and for visualization of different components in heterogeneous materials.
CASE 1: IMAGING OF NORMAL ALKANES ON GRAPHITE
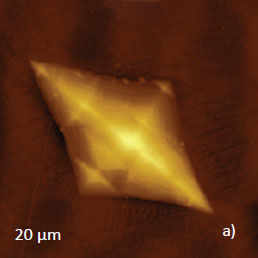
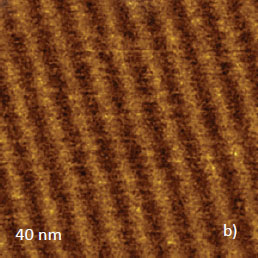
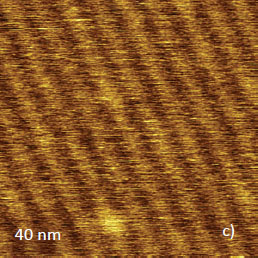
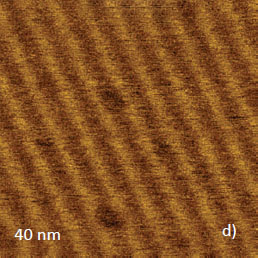
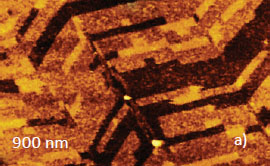
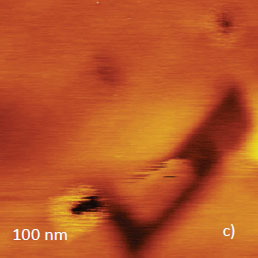
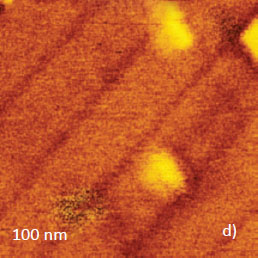
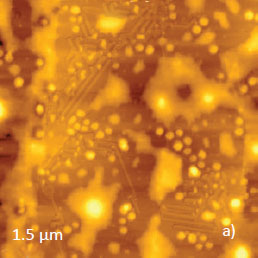
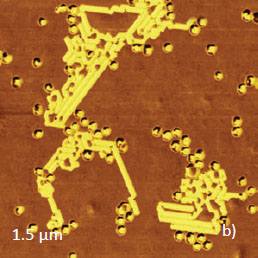
Most FM studies described so far were performed in UHV and liquid with an emphasis on imaging of relatively flat samples and probing the tip-sample forces at the atomic-scale. We have evaluated the imaging capabilities of FM and AM-FI by using a broad range of samples. Two height images, which were obtained in FM mode, are shown in Figures 4a-b.
They were recorded on a crystal of ultra-long chain alkane C242H486, which has a pyramidal shape with a height of ~500 nm, and on a lamellar arrangement of short alkane C36H74 on graphite with a spacing of 4.5 nm.
Height
Height
Height
Frequency
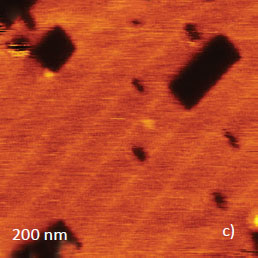
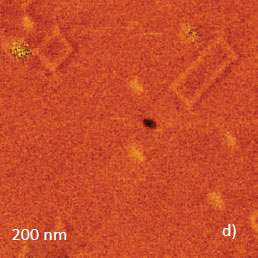
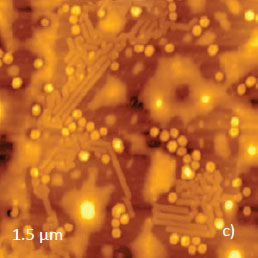
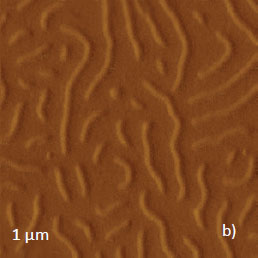
The images were obtained with a negative ∆ωsp at larger probe-sample distances than the ωvZ curve minimum. The height and frequency images of the same sample of C36H74 alkanes were recorded in AM-FI mode, Figures 4c-d. In both images, one can distinguish not only the lamellar edges but also a couple of local adsorbates formed on the lamellar surface by disordered alkane chains. Such defects are rarely seen in the images obtained in AM-PI mode, in which a probe likely sweeps
aside the weakly bonded top structures.
The possibility of observing such structures was confirmed in a combined study of surface of lamellar layers of C242H486 alkanes on graphite in AM-PI and AM modes. A height image of this surface in AM-PI mode (Figure 5a) shows “parquet”-type morphology formed by flat-lying platelets of ~29 nm in width. This spacing is close to a length of an extended C242H486 chain. Thus, these platelets represent individual lamellae.
This finding is supported by the fact that a brightness of height contrast indicates three levels of molecular layers, which differ in height by 0.5 nm (a cross-section of individual alkane molecule). An orientation of lamellar layers most likely due to the grainy structure of the substrate, on which an epitaxial orientation of the alkane takes place. The discussed image was recorded in a low-force operation (Asp close to A0) as is evidenced by the slightly stretched horizontal traces
near the elevated (bright) spherical features.
After the AM-PI imaging the same location was continuously scanned in FM mode at negative ∆ωsp on the long distance side of the frequency minimum. A comparison of the two images from this series (Figures 5b-c) with the one in Figure 5a shows that the surface morphology has changed in a way that an additional alkane material is incorporated in the top layers. We can assume this process has slowly progressed over time.
Height
Height
Height
Height
Height
Height
Frequency
This finding can be explained by the fact that lower force interactions in FM mode allow the weakly bonded material to form the additional top lamellar structures in an overgrowth phenomenon, whereas it is brushed away during AM-PI imaging.
The imaging of C242H486 lamellar layers at a smaller scale was performed with AM-PI and AM-FI modes. We have noticed that the height, phase, and frequency images differed, particular at low-force imaging. Height images of several lamellae were recorded in AM-PI and low- and high-force regimes, Figures 6a‑b.
A force increase was accompanied by the reversible contrast changes, in which the lamellae edges became brighter. The few straight features, which are slightly inclined with respect to the edges, have appeared in the higher force images.
They can be assigned to molecular ordering inside the C242H486 lamellae. In alkane lamellar the molecular tilt is usually related to a demand of tighter packing of the -CH3 end groups, which are more bulky than -CH2- groups forming the alkane chain.
In the low-force imaging of a similar alkane location, collected in AM-FI mode, the height image revealed a missing part of one of the lamellae despite the lamellae edges being practically undistinguished, Figures 6c‑d.
The frequency image of the same location clearly exhibits the lamellar edges yet the lamellar vacancy is not seen. A number of differences between the height and frequency contrast were also observed in the images of a larger area, which was examined at a slightly higher force, Figures 7a-b.
Height
Height
Frequency
Frequency
The height image revealed the lamellae edges, few adsorbates and a number of vacancies including a missing part of one of the lamellae. There are depressions in the individual lamellae. The lamellar edges are slightly elevated as expected for more bulky end groups.
The frequency image is considerably different. The lamellar edges are darker that can be explained by their relative softness due to a more mobile character of the end groups. The missing part of the lamellae is not distinguished in the frequency image but the bright rectangular regions are present at the lamellar depressions.
Tentatively, the frequency variations can be explained by differences in effective elastic modulus of soft top layer and harder underlying lamellar structures. At a higher force, a probe may penetrate a top overlayer and, therefore, height image (Figure 7c) exhibits well-defined lamellar structures coinciding to the frequency features in Figure 7b.
The high-force frequency image (Figure 7d) is characterized by smaller contrast variations than its low-force analog. Hopefully, with an accumulation of experimental data in AM-FI and developments in their analysis, more rigorous interpretation of frequency images will be available.
CASE 2: SELF-ASSEMBLIES OF SEMIFLUORINATED ALKANES ON GRAPHITE
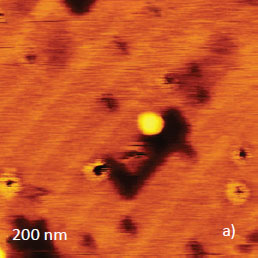
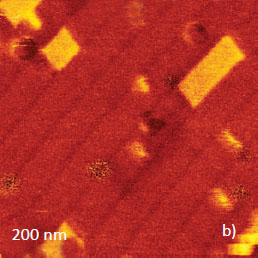
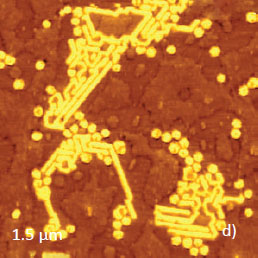
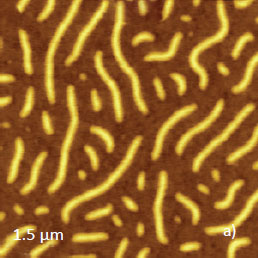
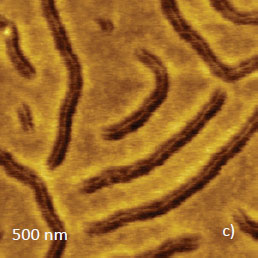
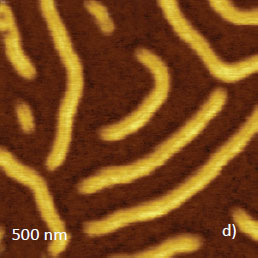
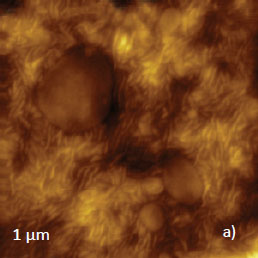
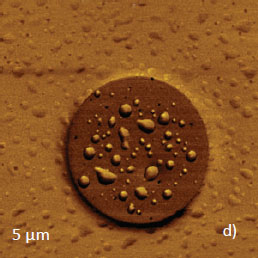
Adsorbates of semi-fluorinated alkanes CF3(CF2)14(CH2)20CH3 (F14H20) on different substrates are often used for illustration of high-resolution of AFM imaging and quantitative mapping of local electrical properties.
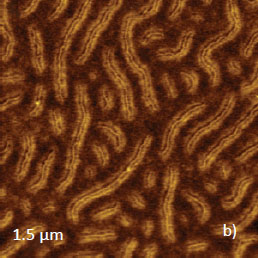
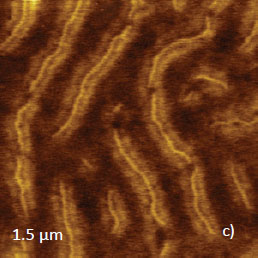
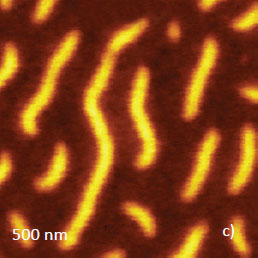
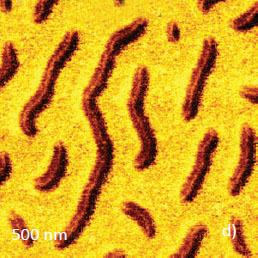
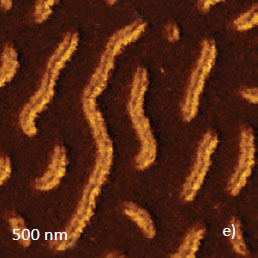
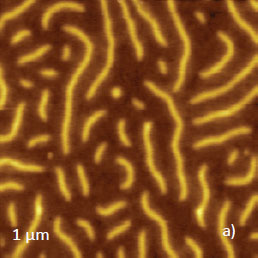
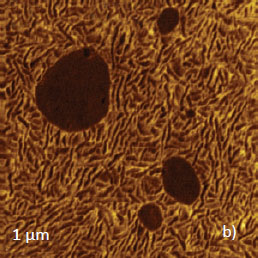
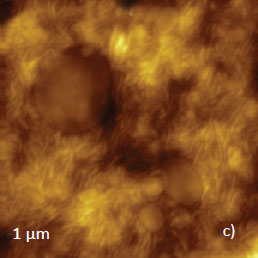
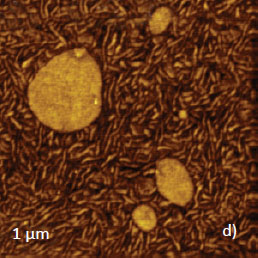
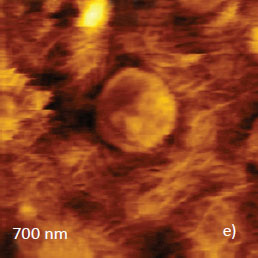
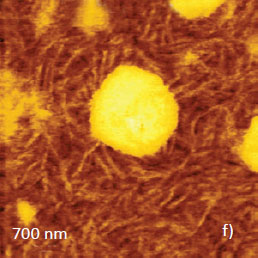
Self-assemblies of F14H20 in shapes of donuts and ribbons surrounded by amorphous patches are common for their adsorbates on graphite. These objects are distinguished in the height image in AM-PI mode, Figures 8a-b.
Height
Phase
Height
Frequency
Dissipation
The molecular organization of these self-assemblies has been examined with Kelvin force microscopy and the vertical orientation of molecules was suggested to be preferential based on the strong surface potential caused by molecular dipoles aligned along the extended molecular core.
This molecular ordering leads to different mechanical properties of the self-assemblies compared to the nearby amorphous domains. The expected differences of local mechanical properties are reflected in the phase image in Figure 8b.
Indeed, the self-assemblies exhibit a pronounced bright phase contrast whereas the rest of the surface structures are barely distinguishable. However, even a small change of Asp in AM-PI mode may cause a drastic alternation of the phase contrast.
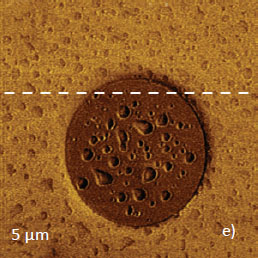
The contrast of the same structures is more consistent in frequency image recorded in AM-FI mode, whereas the height images in both modes are practically identical, Figures 8c-d.In the frequency image the self-assemblies are seen brighter and the contrast has changed as Asp was lowered, and the frequency contrast also reveals other surface structures.
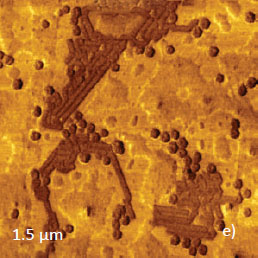
As previously mentioned, the frequency changes correlate with variations of the elastic modulus, with the latter is expected to be higher in the organized self-assemblies. In AM-FI mode, we also recorded the dissipation image, Figure 8e. A level of dissipation, which is measured in pJ/sec, increases as Asp is reduced and the tip-sample force increases. A darker dissipation contrast on self-assemblies hints on their more elastic nature compared to the disordered surroundings.
CASE 3: VISUALIZATION OF BRUSH-LIKE MACROMOLECULES
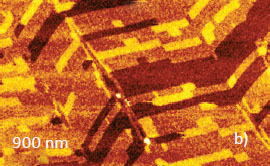
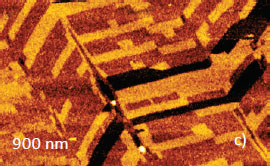
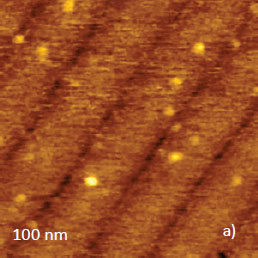
In a comparison of oscillatory resonant AFM modes, data obtained on single brush-like poly(n-butyl acrylate) macromolecules [9] deposited on mica was used. These macromolecules have a unique core chain with side groups yet their structure was not distinguished in AM-PI images.
The height image of these macromolecules, which was recorded in AM-PI mode, shows elongated cylindrical structures whose contour length is determined by chain molecular weight, Figure 9a.
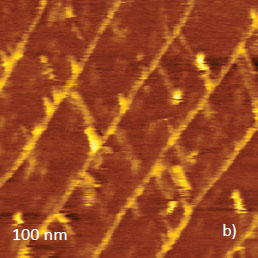
We have reported that the brush-like architecture of the objects is distinguished in height images obtained in Hybrid mode [10], Figure 9b-c.
The tip-forces acting on the macromolecules in this non-resonant oscillatory mode are higher than in AM-PI and the differences in tip-induced deformation of the core and side-chain help to visualize the macromolecular structure.
Height
Height
Height
The imaging of the same macromolecules at smaller scales, which further enhances tip-sample force interactions, led to scission of the macromolecules in weaker spots as seen in the 500-nm height image, Figure 9c. This effect can be explained by local stresses in different parts of macromolecules, which are related to the density of side-chains and specifics of substrate interactions caused by the deposition technique [11].
The visualization of the brush-like macromolecules in Hybrid mode suggests that high-force imaging in AM-PI mode might be needed for similar observations. Indeed, this was achieved using a stiff probe with a spring constant above 100 N/m and also when operating in the 2nd Eigen mode of the probe having a spring constant of 40 N/m.
The images obtained at the same location in AM-PI and AM-FI modes are shown in Figures 10a-e. The height images obtained in both modes at low-force level are similar yet the frequency and dissipation images obtained in AM-FM reveal the structure of individual macromolecules with the core and side chains regions.
As we expected in AM-FI mode (but not in AM-PI mode) the height of the macromolecules changed from 4.8 nm to 3.5 nm as Asp/A0 ratio has decreased from 0.8 to 0.25. Interestingly, at low forces the frequency and dissipation contrasts show the fine structural features.
Height
Phase
Height
Frequency
Dissipation
The observed variations of frequency and dissipation are consistent with the expectation that the side chains regions are softer than the chain core. The regions may cause a larger energy dissipation.
The same macromolecules were examined in FM mode at different tip-sample forces by using ∆ωsp in the (+3Hz) – (-30Hz) range (with a positive sign of the feedback) and -24Hz (with a negative sign of the feedback). The scanning with ∆ωsp = - 24 Hz resulted in a height image similar to the one recorded in AM‑PI mode, Figure 11a. The corresponding dissipation image (Figure 11b) shows only minor contrast variations and small dissipation level.
This outcome is consistent with weak force interactions anticipated for these experimental conditions – the true attractive force regime in terms of quasi-static probe behavior. The height image, which was obtained in the alternative feedback regime at all applied ∆ωsp values, is different, Figure 11c.
It shows the details of the molecular architecture, which includes the core and side-chains regions. Yet the contrast was darker than that of the substrate. Therefore, this height image does reflect not the surface profile but the differences in the force interactions between the tip and macromolecules’ parts.
This suggestion is also consistent with a strong dissipation contrast observed on the macromolecules. The differences between the height and dissipation images at the same negative ∆ωsp at different sides of the frequency minimum confirm that the operations advance at dissimilar forces.
In terms of quasi-static regime these experiments can be assigned to imaging in a truly attractive force mode and in the overall attractive force mode, in which the repulsive force is smaller than the attractive one.
Height
Dissipation
Height
Dissipation
CASE 4: COMPOSITIONAL IMAGING OF POLYMER BLENDS
For more than 20 years compositional imaging of polymer blends was performed with phase images (AM-PI mode). Recently such analysis has been empowered by mapping of local mechanical properties in non-resonant oscillatory Hybrid mode.
Now two other oscillatory modes can also be employed for this purpose. Studies of two immiscible polymer blends: polystyrene (PS) with low-density polyethylene (LDPE) and polyvinyl acetate (PVAC) are presented as the illustration. In the PS/PVAC blend, both components are amorphous and their macroscopic elastic moduli are in the 2-3 GPa range. In PS/LDPE blend, amorphous and more rigid PS (macroscopic elastic modulus ~3.0 GPa) is mixed with semicrystalline LDPE, whose macroscopic modulus varies in the 200-400
MPa range.
Existing as semicrystalline in nature, LDPE has lamellar structures with a width in the 20-30 nm range, which are embedded into amorphous polymer.
At room temperature, this amorphous polymer is in a rubbery state since its glass transition temperature is well below 0 °C. Therefore, substantial differences in local elastic modulus are expected at the tens of nanometers scale. Height and phase images of PS/LDPE film, which were obtained at high-force level in AM-PI mode, are shown in Figures 12a-b. In contrast to the low-force image, in which the phase contrast is practically featureless, the high-force phase image reveals a binary morphology of this blend and also a lamellar structure of LDPE.
A dark phase contrast of the round-like domains indicates that these areas are enriched with stiffer component, PS. A matrix is enriched in LDPE and its lamellar structure is seen as the 20-nm wide strips with alternative contrast. The darker strips can be attributed to stiffer lamellae and the brighter strips – to softer amorphous LDPE.
Height
Phase
Height
Frequency
Height
Elastic Modulus
The high force height and frequency images obtained in AM-FI mode (Figures 12c-d), are quite similar to those obtained in AM-PI mode. The only differences are linked to a brighter contrast of PS domains and to an inversion of contrast of LDPE features. As we have clarified, the above the frequency variations are closely related to the elastic modulus changes and, therefore, the polymers with higher elastic modulus result in images with brighter contrast. This relationship is further confirmed
by the height
image and elastic modulus map, which were recorded in Hybrid mode at 20 nN force, Figures 12e-f. This force causes some damage seen in the height image but the map contrast shows that the elastic modulus of PS domains is mostly in the 2-3 GPa range and the elastic modulus of LDPE is around 0.5 GPa. Both values are similar to macroscopic elastic modulus of these polymers.
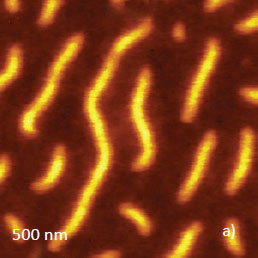
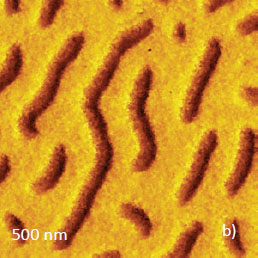
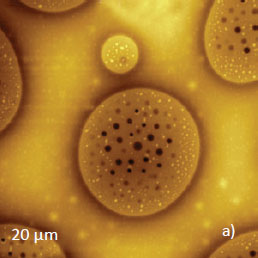
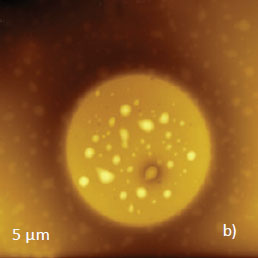
Surface morphology of 300-nm thick PS/PVAC film is characterized by the circular perforated domains embedded in a practically homogeneous matrix, Figures 13a-b. The earlier AFM/Raman study of this sample helped in assigning the domains to PS and the matrix - to PVAC [12].
A smaller area with more compact domains has been examined in AM-PI, AM-FI and Hybrid modes.The height and phase images (not shown here), which were obtained at different Asp, exhibit only a small phase contrast difference between the circular domain and surrounding matrix.
A clearer differentiation between these areas was revealed in the frequency and dissipation images, Figure 13c-d. In the frequency image, a central domain, which is enriched in PS, is seen with darker contrast than the matrix.
In the dissipation image the PS domains show a lower dissipation that might be explained by a more elastic nature of this polymer whose glass transition is at substantially higher temperature (100 ˚C) than that of PVAC (40 ˚C). The examination of the same area of PS/PVAC film in Hybrid mode has revealed that elastic modulus of the central location is around 2.5 GPa and the matrix’s modulus around 3 GPa, Figures 13e-f.
The elastic modulus of the circular domain enriched in PS is close to macroscopic modulus of this polymer, whereas the modulus of the PVAC-enriched area is slightly higher than the macroscopic modulus of this polymer. This finding deserves a detailed consideration that may account for a possible dependence of PVAC modulus on frequency. The measurements in Hybrid mode were performed at 1.5 kHz which is much faster than is common of macroscopic studies of polymers.
Height
Phase
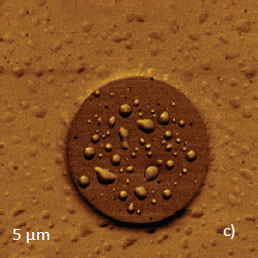
Frequency
Dissipation
Elastic Modulus
Elastic Modulus
CONCLUSIONS
Despite two of decades of AFM developments, there is still room for expanding the capabilities of this characterization technique. Recently, the advances in the microscope tools were implemented into new, non-resonant oscillatory Hybrid mode.
This mode is successfully used for quantitative and high-resolution mapping of local mechanical properties [13], and offers a number of other improvements. The resonant oscillatory techniques are being continually expanded and enhanced through the addition of AM-FI and FM modes to complement the most common AM-PI mode.
The initial steps of the validation of AM-FI and FM modes on a number of various samples are described above. The results show that in imaging of several materials the frequency images exhibit more pronounced and different contrast compared to phase images of AM-PI mode.
This was particularly well seen in the visualization of the structure of the brush-like macromolecules. The described correlation between the frequency changes and variations of the elastic modulus is another useful feature of AM-FI mode that facilitates the image analysis. The implementation of FM mode allows expansion of AFM imaging to broad force regimes utilizing ∆ωsp at large range of probe-sample distances with a particular emphasis on low-force imaging of soft matter.
Another advantage that accompanies the imaging in AM-FI and FM modes is the recording of quantitative dissipation maps, which are calculated using the appropriate formulas and displayed simultaneously with other images. The dissipation contrast reveals local differences in probe interactions with various components of complex samples and it can be useful for the examination of viscoelastic properties of materials at small scales.
REFERENCES
[1] Q. Zhong, D. Innis, K. Kjoller, and V. Elings “Fractured polymer/silica fiber surface studied by tapping mode atomic force microscopy” Surf. Sci. Lett. 1993, 290, L688–L692.
[2] T. Albrecht, P. Gruetter, D. Horne, and D. Rugar “Frequency modulation detection using high-Q cantilevers for enhanced force microscopy sensitivity” J. Appl. Phys. 1991, 61, 668.
[3] T. Fukuma, T. Ichii, K. Kobayashi, H. Yamada, and K. Matsushige “True-molecular resolution imaging by frequency modulation atomic force microscopy in various environments” Appl.Phys. Lett. 1995, 86, 034103–034105.
[4] S. Belikov and S. Magonov “Classification of dynamic atomic force microscopy control modes based on asymptotic nonlinear mechanics” Proceedings American Control Society, St. Louis, 979-985, 2009.
[5] R. E. Best “Phase-Locked Loops” 2003, p.292, The McGraw-Hill Companies, Inc
[6] D. Maugis, Contact, Adhesion and Rupture of Elastic Solids, Springer, 2000, pp. 16, 31.
[7] S. Magonov “AFM in analysis of polymers” in Encyclopedia of Analytical Chemistry, R. A. Meyers, Ed., pp. 7432–7491, John Wiley & Sons Ltd, Chichester, 2000.
[8] S. Belikov, J. Alexander, C. Wall and Sergei Magonov “Tip-Sample Forces in Atomic Force Microscopy: Interplay between Theory and Experiment” MRS Proceedings 2013, 1527, mrsf12-1527-uu02-04.
[9] S. S. Sheiko, B. S. Sumerlin, and K. Matyjaszewski “Cylindrical molecular brushes: Synthesis, characterization, and properties” Progr. Polym. Sci. 2008, 33, 759–785.
[10] S. Magonov “Expanding atomic force microscopy with Hybrid mode imaging” NT‑MDT SI Application note 087, 2013.
[11] S. S. Sheiko, F. C. Sun, A. Randall, D. Shirvanyants, M. Rubinstein, H. Lee and K. Matyjaszewski “Adsorption-induced scission of carbon–carbon bonds” Nature 2006, 440, 191-194.
[12] M. Surtchev, S. Magonov, and M. Wall “Characterization of materials with a combined AFM/Raman microscope” NT-MDT Application note 089, 2015.
[13] S. Magonov, M. Surtchev, S. Belikov, I. Malovichko and S. Leesment “Quantitative nanomechanical measurements in Hybrid mode atomic force microscopy “ NT-MDT Application note 090, 2015.