


AFM–Raman Characterization of Li-ion Batteries
Application Note 093 (pdf 2.2 Mb)
Sergey Shashkov, and Pavel DorozhkinQuantum Design, Japan
NT-MDT Co., Moscow Russia
INTRODUCTION
Development of advanced lithium batteries currently represents a very rapidly growing field of science and technology. Lithium batteries are interesting as a power source in numerous portable devices such as notebook computers, cellular phones and camcorders, in electrical vehicles, in military and aerospace applications.
Layered lithium cobalt oxide LiCoO2 (Fig. 1) is the most commonly used cathode material in commercial lithium batteries. This is due to its longer cycle life, lower self-discharge rate and higher energy density compared to other rechargeable batteries (lead-acid, nickel cadmium or nickel metal hydride), higher cost effectiveness and smaller toxicity.
The layered form of LiCoO2 has a rhombohedral symmetry with the cell parameters a=2.816 Å and c=14.09 Å [1]. Li and Co ions occupy alternate layers in octahedral sites between the close packed oxygen planes (Fig. 1).
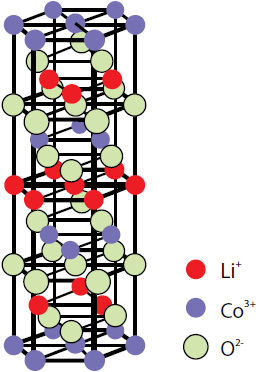
Fig. 1. Layered LiCoO2 structure.
LiCoO2 structures have been extensively investigated, because such layered structures are perfectly suited to accommodate large changes of the Li content and provide the best pathway for Li+ diffusion in and out of the lattice of crystal during the charge–discharge processes:
LiCoO2  Li1-xCoO2 + xLi+ + xe-
During charging, lithium is de-intercalated from the cathode layers (LiCoO2 cathode becomes de-lithiated, i.e.
During the discharge process, the lithium ions are de-intercalated from the anode, migrated across the electrolyte, and intercalated again to the empty octahedral site between layers in the cathode (deficit of Li is decreased and cathode transforms to LiCoO2 again), the compensating electrons go to the external electrical circuit.
Such a completely reversible lithium intercalation process is the key to the rechargeable Li battery. It is the ordinary process for any non-defective lithium battery.
Effects of protracted cycling (when charge and discharge cycles are repeated very often) or prolonged storing bring batteries away from their initial good performance.
With the course of time, a surface film consisting of variety of salts may be formed on the cathode or anode.
It means that lithium ions must additionally travel through this new film. It may change the surface electrochemistry and lead to the unconventional charge/discharge chains.
There are also irreversible processes of electrolyte oxidation and reduction. Batteries can be overcharged with such circumstances; the cathode can undergo phase transformations. Microcrystals of
The c-axis of the crystal unit cell is increased from 14.09 Å to 14.26 Å, but the a-axis is decreased a bit (from 2.816 Å to 2.812 Å) at such transformation. As a result, the volume expansion of few percent is observed [1].
Phase transformations can lead to deterioration of electrical performance or even to degradation of cathode due to the mechanical strain, for example.
Significant deformations in CoO6 octahedrons and formation of Co3O4 / Li2O can disrupt the intercalation / de-intercalation frameworks.
The formation of lithium oxide (Li2O) inside batteries during prolonged cycling or storing according to the following reaction [2]
3LiCoO2 + Li+ + e- = Co3O4 + 4Li2O
can not be reversed electrochemically without destroying the battery. The cathode degrades through loss of Li2O and transforming LiCoO2 into electrochemically inactive Co3O4.
Understanding distribution of degraded areas on the surface of a positive electrode is very important to improve life time of the batteries.
With the current trend of miniaturization and performance improvement, there is a need for knowledge of Li-ion batteries, Li intercalation and cathode degradation, on a sub-micron scale.
EXPERIMENTAL
Raman spectroscopy and atomic force microscopy (AFM) are valuable methods for the structural characterization of materials used as electrodes in rechargeable lithium batteries (LiCoO2 in particular). In this note, we present results on a LiCoO cathode characterization measured by AFM and Raman techniques on the integrated instrument NTEGRA Spectra (NT-MDT) integrated with Renishaw inVia Raman spectrometer. The instrument allows simultaneous recording of various AFM and Raman images
from the same
sample area.
Typical structure of lithium-ion rechargeable cylindrical cell is shown on Fig. 2. The three primary functional components of a lithium-ion battery are the anode, cathode, and electrolyte. Carbonaceous material is used as an anode material (the most commercially popular anode material is graphite).
The inorganic compound, LiCoO2, is used as the cathode material in the cylindrical cell. The electrolyte is a lithium salt in an organic solvent. The soft separators used in batteries must avoid direct contact between the anode and cathode, but they must allow a free transport of the electrolyte and lithium ions. The batteries typically have a nominal voltage around 3.7 volts.
Individual Lithium-ion ICR-18650 cylindrical cells from different laptop Lithium Battery Packs were investigated.
The first battery pack was used for about 3 years, passed about 1200 charging/recharging cycles and had only about 25% of nominal capacity; the battery was ~30% charged. The second battery was new and ~65 % charged.
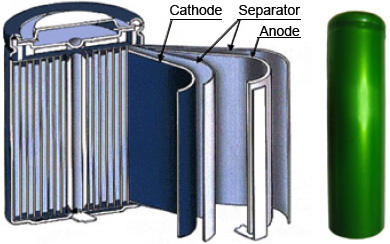
Fig. 2. Structure of Lithium-ion battery
Cylindrical cells were opened to separate the cathodes. Cathodes were immediately washed with anhydrous tetrahydrofuran and dried through the blotting paper after opening the cell. This procedure removed electrolyte salt from the electrode to prevent its reaction with moisture in air.
RESULTS
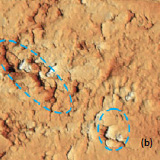
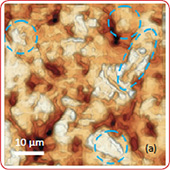
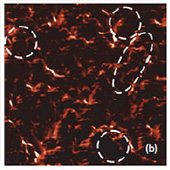
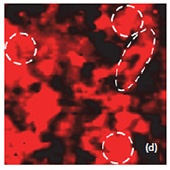
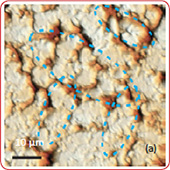
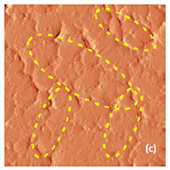
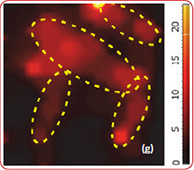
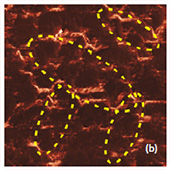
The surface morphology of LiCoO2 cathode analyzed by AFM is presented in Fig. 3. AFM topography (Fig. 3a-b), provides information about size of grains, their shape and orientation. Lattice constants of cathode material are a function of the lithium concentration, x, in Li1-xCoO2 as described above. As a result, the surface of the new LiCoO2 cathode is more smooth [3]; size of grains derived from the AFM topography images is ~2–2.5 µm. The used
battery, cathode
exhibits high roughness and grain structure; size of grains is ~2.5–3.5 µm. This is typical, due to the lithium extraction (in case of de-lithiated LiCoO2), the crystal cell of LiCoO2 is expanded and individual strained microcrystals of the cathode material may be observed on the surface.
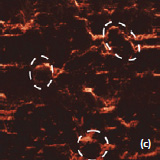
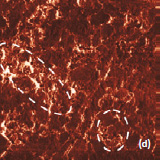
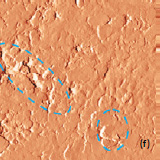
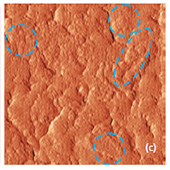
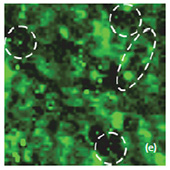
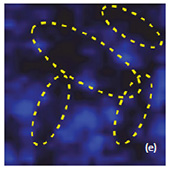
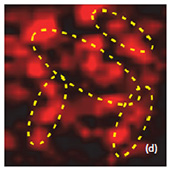
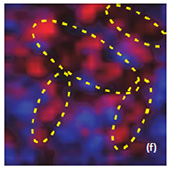
Phase and magnitude of cantilever oscillation recorded during scanning provide complementary information to AFM topography. Phase imaging shows a clear contrast once there is a detectable variation of interaction forces between cantilever and surface. Thus, phase images highlight grain edges and are not affected by large-scale height differences providing clearer observation of the sample fine features (Fig. 3c-d). Magnitude (cantilever oscillation amplitude signal) provide additional contrast (Fig. 3e‑f):
grain edges are also clearly observed because control electronics does not respond instantaneously to the sharp changes in the sample height.
Used battery
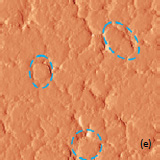
New battery
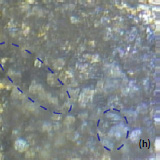
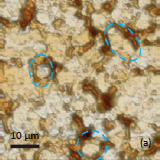
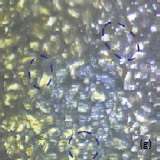
Optical images give complementary information to the AFM measurements. There is not complete correlation between the optical and AFM images (Fig. 3). Optical images of the cathode are formed by reflected light that is sensitive to the nature of the interface and grain reflection properties. The amount of light reflected back to the video CCD depends on crystal surface orientation.
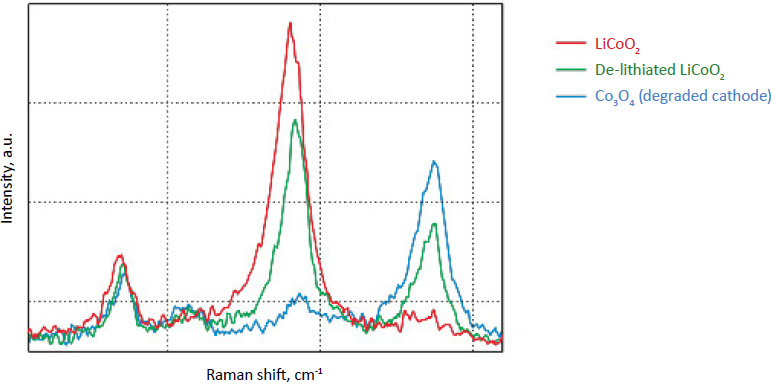
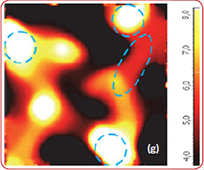
Raman spectra of the LiCoO2 cathode depend on the electrochemical history. From different points on the cathode (Fig. 3) different spectra can be observed (Fig. 4).
By factor group analysis, the total irreducible representation for the vibrational modes of LiCoO2 is obtained as A1g + 2A2u + Eg + 2Eu. The gerade modes are Raman active and the ungerade modes are IR active. Only two bands should be observed in Raman spectra of LiCoO2: A1g+ Eg. In fact, experimental spectra of LiCoO exhibit two strong bands at 472 cm-1 and 579 cm-1 with the intensity ratio of 1:3 (red spectrum on Fig. 4), which correspond to oxygen
vibrations involving v2 (Eg), O-Co-O bending, and v1 (A1g), Co-O stretching modes, respectively (Fig. 5). In the A1g mode two oxygen atoms vibrate in the opposite directions parallel to the c-axis of LiCoO2, while in the Eg mode they vibrate in the opposite directions parallel to the Co atom planes [4] (Fig. 5).
The positions of these peaks and their intensity are very sensitive to the long- range order in CoO2 slabs.
Upon the extraction of lithium from the cathode (during battery charging process), some changes are observed in the Raman spectra (green spectrum in Fig. 4). The intense peaks of the LiCoO (472 cm-1 and 579 cm-1 bands) experience a small spectral shift. Intensity of 515 cm-1 and 674 cm-1 bands is increased. The peak centered at 674 cm-1 (blue spectrum in Fig. 4) may be assigned to a mode vibration of Co3O4 species; the
peak at 515 cm-1 may be assigned to a mode vibration of Li2O.
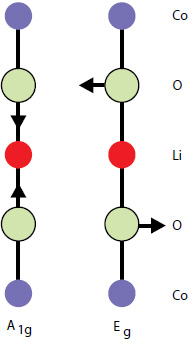
Fig. 5. Atomic displacements of the Raman-active modes of LiCoO2

CONCLUSIONS
This study has demonstrated the importance of correlated AFM-Raman imaging for Li-ion battery studies. Raman imaging allows to characterize in details lithium intercalation processes and degradation of the cathode.
Simultaneous AFM imaging allows one to correlate cathode chemical properties with its topography (roughness, grain structure etc.).
ACKNOWLEDGEMENT
NT-MDT is grateful to Renishaw K.K. (Tokyo) for providing inVia Raman spectrometer for the integrated AFM‑Raman instrument used in this work.
REFERENCES
[1] J. N. Reimers, J. Dahn, J. Electrochem. Soc, 139 ,8 (1992) 2091.
[2] E. Markevich, G. Salitra, D. Aurbach, Electrochem. Commun. 7 (2005) 12981304.
[3] Y. Park, Nam Hoon Kim, Ja Young Kim, In-Yong Eom, Yeon Uk Jeong, Min Soo Kim, Sung Man Lee, Hyun Chul Choi, Young Mee Jung, Vibrational Spectroscopy 53 (2010) 6063.
[4] Kazunory Ozawa, Lithium Ion Rechargeable batteries: Materials, technology, and new application, Wiley-VCH Verlag GmbH&Co, Weinheim, 2009.